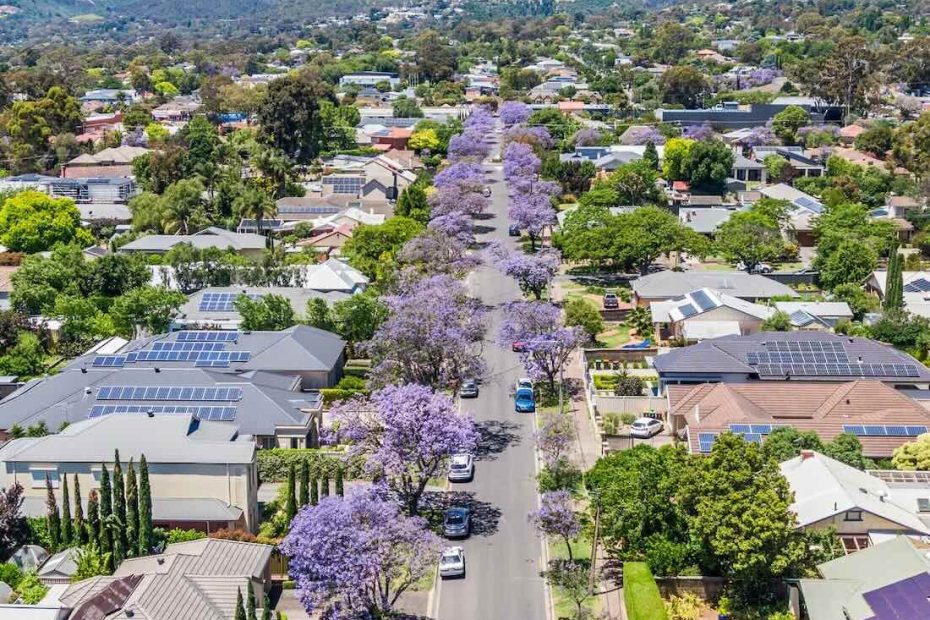
Sunny Spring weather has delivered two new records for peak rooftop solar generation in two Australian states, as the enormous value of consumer energy resources, starting with panels on homes, continues to make itself known on Australia’s main grid.
The first and perhaps most significant record was set on Wednesday in South Australia, where the energy generated by rooftop solar in the state passed 2 gigawatt (GW) for the first time and hit a new instantaneous output high of 2,070 megawatts (MW) at 12.30pm.
As Global Power Energy’s Geoff Eldridge notes on LinkedIn, this new peak is 100 MW and just over 5 per cent higher than the previous record of 1,970 MW on 22 September.
South Australia already leads the world in its share of wind and solar in the local grid, and is the first gigawatt scale grid where rooftop solar alone has accounted for all local demand.
According to the Clean Energy Council, South Australia had around 2.85 GW of rooftop solar installed at the end of 2025, and it has consistently led the nation for per capita installed capacity, with panels on around 50 per cent of all dwellings.
This is why the state has also led the nation on integrating distributed solar, pioneering the evolution of things like flexible exports while also being first to introduce an emergency backstop mechanism to remotely control rooftop PV systems in cases of grid management emergency.
The second record set on Wednesday was over to the east on the National Electricity Market (NEM), in Victoria, where rooftop solar output hit a new high of 4,191 MW at midday. According to Eldridge, that is 155 MW higher (+3.85%) than the previous record of 4,036 MW on 5 January 2026.
As Eldridge explains, “these are instantaneous output records, not daily energy production records,” and to this end “they reinforce the expanding contribution of consumer energy resources and the changing daytime operating environment across the NEM.”
The GPE NEMLog charts shared above and below show the regional energy mix and rooftop PV profiles for October 07, alongside historical daily maximum, mean and minimum summaries since March 2018.
“At the record peaks, regional demand was just 201 MW in SA and 3,734 MW in Victoria, compared with native demand of 2,271 MW and 7,925 MW respectively,” Eldridge writes on LinkedIn.
“Both regions were exporting, with negative wholesale prices (-$59/MWh in SA and -$30/MWh in Victoria). Grid-scale batteries consumed 247 MW in SA and 917 MW in Victoria, while renewable curtailment reached 729 MW and 1,223 MW respectively.
“This highlights the growing role of rooftop PV, storage and interconnectors in balancing solar-rich electricity systems.”
Eldridge says the “big unknown” for South Australia and other states is the impact of home batteries on peak rooftop solar output, as more and more households add batteries and store at least some of their daily PV production for self-consumption or export later in the day.
“At the rooftop PV peaks, some solar generation would have been absorbed by these batteries, while others may have been discharging. How much? We don’t yet know,” he writes.
“Rooftop PV estimates, operational demand and grid-scale battery figures cannot provide a complete picture of electricity generation, storage and consumption behind the meter.
“As consumer battery installations grow, this visibility gap becomes increasingly important.”
If you would like to join more than 29,000 others and get the latest clean energy news delivered straight to your inbox, for free, please click here to subscribe to our free daily newsletter.
Sophie Vorrath
Sophie is editor of Renew Economy and editor of its sister site, One Step Off The Grid . She is the co-host of the Solar Insiders Podcast. Sophie has been writing about clean energy for more than a decade.
Share this:
Facebook
X
LinkedIn
Reddit
Email
Print